Markets based on tradeable instruments such as stocks, bonds, forex, cryptocurrencies and commodities may sound very sophisticated. It may be because of those movies showing how stockbrokers seem so sleek and smart or maybe because of the mere fact that these tradeable instruments are now traded online through a computer. However, although these markets may seem very sophisticated, the reality is that the same concepts trading real world hard items also apply to such tradeable instrument markets.
The main simplistic concept of trading is simply to buy low and sell high. That is what every intelligent trader would always do, whether he is dealing in physical items or in tradeable instruments.
Let’s take a look at a jeweler dealing with diamonds. This jeweler who is very keen with the market might notice that the market price for diamonds is starting to rise coming from an all time low. This is what we traders would call a trend reversal. As the rising price trend for diamonds is established, the jeweler might say he would want to make money in this market. He would not buy right away even if the price is very high. The wise jeweler would wait for opportunities wherein he could buy diamonds at a price lower than the current market value. This way as the price for diamonds would rise, he could then make more profits.
The method that this diamond jeweler is doing trading physical diamonds is what we traders would call a trend following strategy, wherein we are buying on dips and selling as the market would rally. The concept for this type of trading is very simple. We look for a market, it may be a stock, commodity or any forex pair, that has an established trend. Assuming it is an uptrend, we then wait for price to retrace towards the average price. We then buy as soon as we see price dipping. Then, we sell as the market price spikes up.
On the flip side, when the market is in a downtrend, we could also short the market. This is done by first making a sell trade, as price retraces towards the mean, then closing the trade with a buy as soon as price drops down.
The key to a trend following strategy is in clearly identifying a trend and entering a trade during the retracement just before the market spikes in the direction of the trend once again.
Objectively identifying a trend may be easy for seasoned traders. However, new traders might still find it difficult. For this reason we will be looking at how the Heiken Ashi Smoothed indicator can be used to help us trade with the trend.
Heiken Ashi Smoothed Indicator
Heiken Ashi in Japanese literally translates to average bars, which is very fitting for the Heiken Ashi Smoothed indicator as it is also based on average price movements.
The Heiken Ashi Smoothed indicator, also known as Heiken Ashi Moving Average or HAMA, is a trend following technical indicator which is a variation of the Heiken Ashi Candlesticks. Although the Heiken Ashi Smoothed indicator is a variation of the Heiken Ashi Candlesticks, the two indicators are very different.
The Heiken Ashi Candlesticks resemble a candlestick with the same highs and lows as a Japanese candlestick but only changes color whenever its underlying mathematical computation detects a short-term trend reversal.
The Heiken Ashi Smoothed indicator on the other hand is derived from a modified moving average computation based on the highs, lows and close of each candle. As such, the Heiken Ashi Smoothed indicator behaves much more like a moving average line displayed with candlesticks.
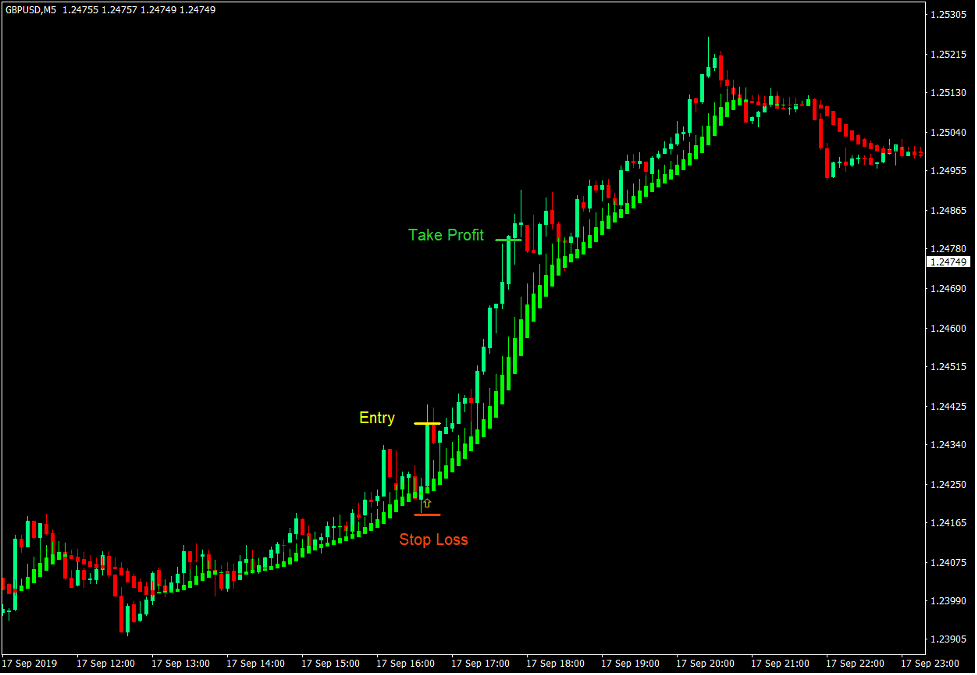
The Heiken Ashi Smoothed indicator plots bars which follows price action quite closely. These bars represent the area of the average price, much like a moving average line.
The color of its bars indicates the direction of the trend it detects. In this setup, lime bars indicate a bullish trend bias, while red bars indicate a bearish trend bias.
The Heiken Ashi Smoothed indicator is characteristically very smooth, which makes its name very fitting. At the same time, despite its smoothness, it still reacts to price changes quite responsively, making it a reliable trend following indicator.
As such, the Heiken Ashi Smoothed indicator is an excellent trend direction filter indicator based on the color of the bars it plots. It can also be used as a trend reversal entry signal based on the changing of the color of its bars.
Since the Heiken Ashi Smoothed indicator represents the area of the average price, it can also be used as a dynamic area of support or resistance where price can retrace and bounce from.
Dynamic Area of Support or Resistance
Most traders identify support or resistance as a static line based on the connection of more than two swing points. These lines are considered as areas where price may bounce from.
Some traders use horizontal support based on a prior swing low, and horizontal resistance levels based on a prior swing high.
Both these methods are viable classic ways of identifying support or resistance levels. However, there is a third way of looking at support and resistance levels.
Dynamic areas of support and resistance are areas where price may bounce from as a support or resistance level which are based on a dynamic technical indicator. This may either be based on moving averages or band-based indicators.
Heiken Ashi Smoothed Dynamic Area of Support or Resistance
The Heiken Ashi Smoothed indicator is an excellent indicator for identifying trending markets. It effectively identifies the direction of trending markets and quickly indicates whenever the trend is starting to reverse.
Aside from this, the Heiken Ashi Smoothed indicator is also an excellent dynamic area of support or resistance level. Price tends to retrace towards this area in a trending market and quickly reverses away from it after the retracement.
Uptrend Heiken Ashi Smoothed Dynamic Support
- The Heiken Ashi Smoothed bars should be lime.
- Confirm if the market is in an uptrend based on the characteristics of price action swings.
- Wait for price to retrace towards the area of the Heiken Ashi Smoothed indicator.
- Enter a buy trade as soon as price signifies price rejection on the area of the Heiken Ashi Smoothed indicator based on either a bullish pin bar or engulfing pattern.
- Set the stop loss below the entry candle.
- Set the take profit target at 2x the risk on the stop loss.
Downtrend Heiken Ashi Smoothed Dynamic Resistance
- The Heiken Ashi Smoothed bars should be red.
- Confirm if the market is in a downtrend based on the characteristics of price action swings.
- Wait for price to retrace towards the area of the Heiken Ashi Smoothed indicator.
- Enter a sell trade as soon as price signifies price rejection on the area of the Heiken Ashi Smoothed indicator based on either a bearish pin bar or engulfing pattern.
- Set the stop loss above the entry candle.
- Set the take profit target at 2x the risk on the stop loss.
Conclusion
Trend following strategies are some of the most effective ways to trade the forex market. It may at times be more accurate compared to trend reversal setups because we are trading against an existing trend.
The key to trading trend continuation strategies effectively is in correctly identifying a trending market and identifying when and where to enter the market. This is where the Heiken Ashi Smoothed indicator excels. As such, trading trend following strategies using the Heiken Ashi Smoothed indicator as a dynamic area of support or resistance is a good way to trade a trending market.


